www.ptreview.co.uk
06
'21
Written on Modified on
Hexagon helps global manufacturers to pinpoint the root causes of quality anomalies from global production site data with new solution
Web-based dashboard analyses quality data to highlight trends in production and supplier quality from part to product.
A new web-based dashboard enabling the rapid analysis of global quality data has been launched by Hexagon’s Manufacturing Intelligence division to help quality professionals easily identify trends in declining quality for parts and assemblies and investigate the issues relating to specific components, suppliers, projects, and locations.
As quality-control processes at separate production facilities are typically disconnected, it can be challenging for global manufacturers to achieve accurate and detailed analyses of quality issues linked to specific components, suppliers, projects, and locations. Through a highly visual, web-based quality dashboard, the new solution enables quality professionals to intuitively analyse aggregate data at a glance from any web browser and rapidly identify cases that require urgent intervention.
Manufacturers that build complex assemblies must ensure that final products can be seamlessly constructed from thousands of parts from suppliers and in-house production facilities around the world. For example, the automotive body in white (BIW) comprises rear-end panels and wheel housings made by different suppliers at different global assembly plants.
While the quality of parts and assemblies can be confirmed with inspection as the BIW moves through production, many manufacturers don’t have global visibility that makes it possible to spot emerging issues linked to specific projects or locations, or to pinpoint parts from suppliers that are consistently out of tolerance.
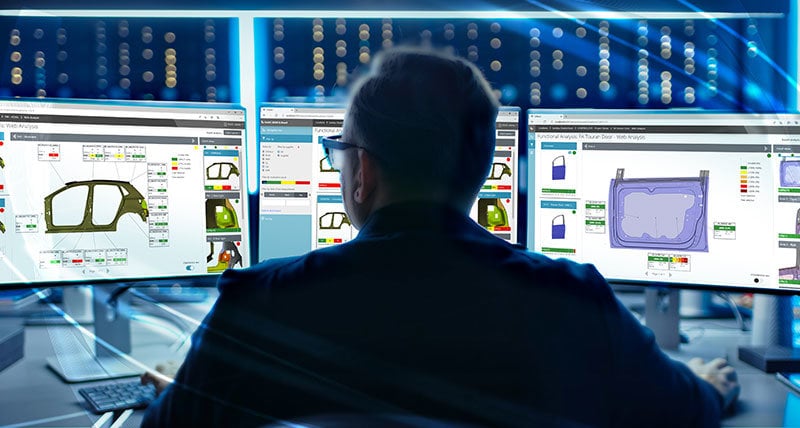
The new dashboard presents an overview of a site and project from which the user can drill down into hierarchical layers of detail about a project’s components. Powerful data aggregation capabilities make it easy to, compare design data such as the computer-aided-design (CAD) geometry of a car door with inspection data for the manufactured door and associated door components across several locations.
The new solution is underpinned by Hexagon’s vendor-agnostic Q-DAS eMMA MDM (measurement data management) software, which acquires metrology data from every production site to provide single reliable source of quality data. These data can then by interpreted by locally installed and web-based quality tools such as the new dashboard to analyse trends in dimensional accuracy and utilise quality data collected at multiple locations. The solution manages data throughout the manufacturing process, to that tools can automatically compare inspection data to design data to ensure that manufacturers adhere to original design intent parts are received, produced or assembled.
“We want to help manufacturers get the most mileage from the data that they’re already generating by removing the guesswork from assembly,” Diana Fernandez, product manager said. “The dashboard is a tool used to automatically collect, organise, and present critical data in a central location that makes the information easy to understand and act upon. It provides a higher level of insight and control so they can proactively mitigate issues with their plants and supply chain.”
Available from April 2021, Q-DAS eMMA Q-Board enables quality professionals to intuitively analyse aggregate data at-a-glance from any web browser. The dashboard’s interactive visualisation enables users to navigate from a CAD assembly and click through to components and their associated quality parameters including tolerance deviation, CP, CPK, the degree of fulfilment and others. Quality data is presented through colour-coded “traffic light” user interface that supports the rapid detection of cases that require urgent action trends in key performance indicators to accelerate decision making.
Dashboards can visualise data according to various aggregation criteria, such as location, project, functional group or analysis, feature, characteristic, and more. Users can also filter their view based upon factors such as tolerance parameters and build phase, providing additional levels of customization to meet the requirements of specific production environments.
www.hexagonmi.com